DevLogBus
DevLogBus Documentation
DevLogBus is a real-time log viewer for full-stack development. It coalesces
records from backend services, CLI/TUI tools, Chrome tabs, Linux journald,
direct HTTP calls, and language SDKs so a developer can see them side by side or
merged into one local timeline.
DevLogBus is not a production observability platform. It does not provide retention, alerting, metrics, tracing, multi-user auth, or a hosted cloud backend. The design center is a single developer or trusted workstation during active debugging, where cause and effect matter right now.
Start Here
- Quickstart: install binaries, run the daemon, open the UI, emit a test record, and install Browser Tap without Go or Node.
- Introducing DevLogBus: standalone GitHub Pages project page for people who just need the pitch.
- Why DevLogBus Exists: the problem it solves, who it is for, who it is not for, and the local-first philosophy.
- Daemon: runtime model, endpoints, settings, replay buffers, health/about endpoints, systemd, and troubleshooting.
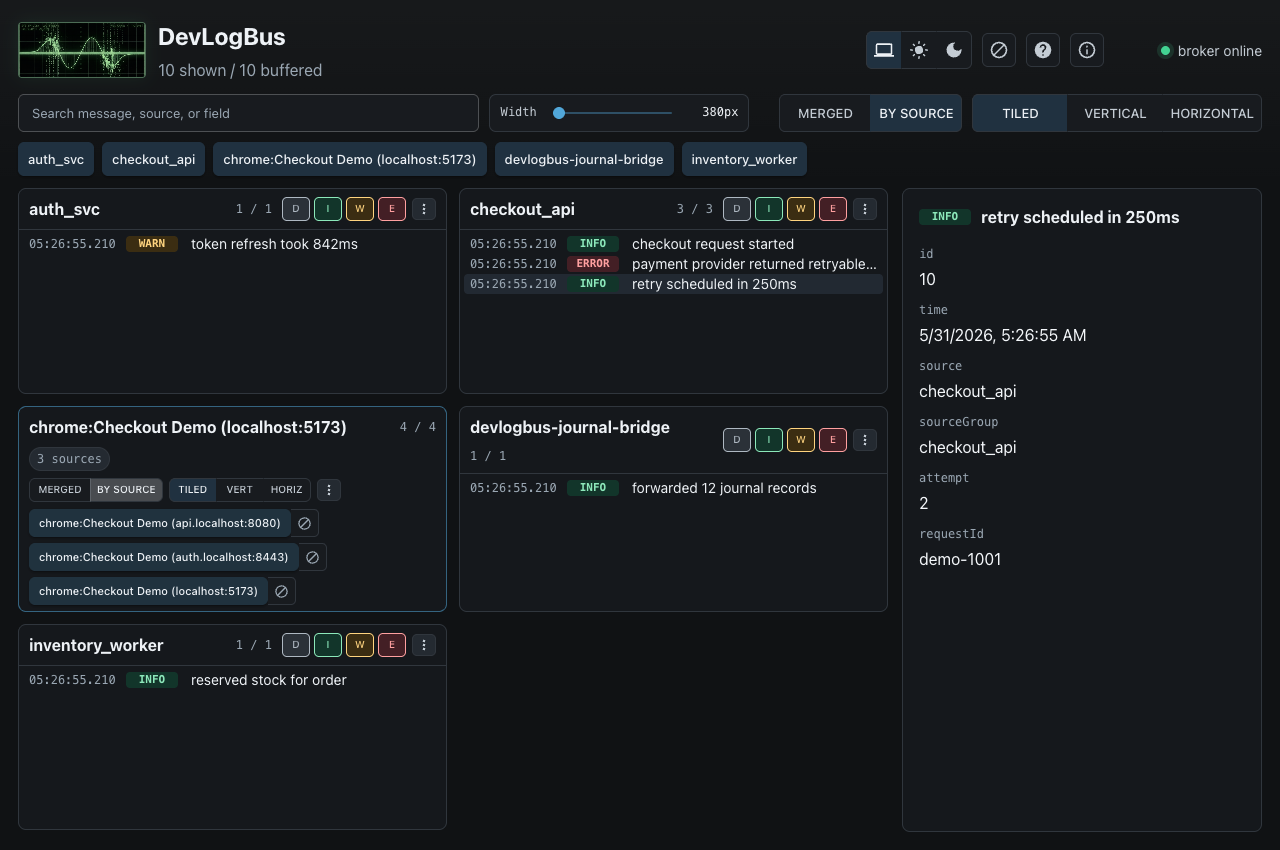
- Browser UI: merged view, by-source view, Chrome source groups, popouts, blocked sources, clear, expunge, help, and about.
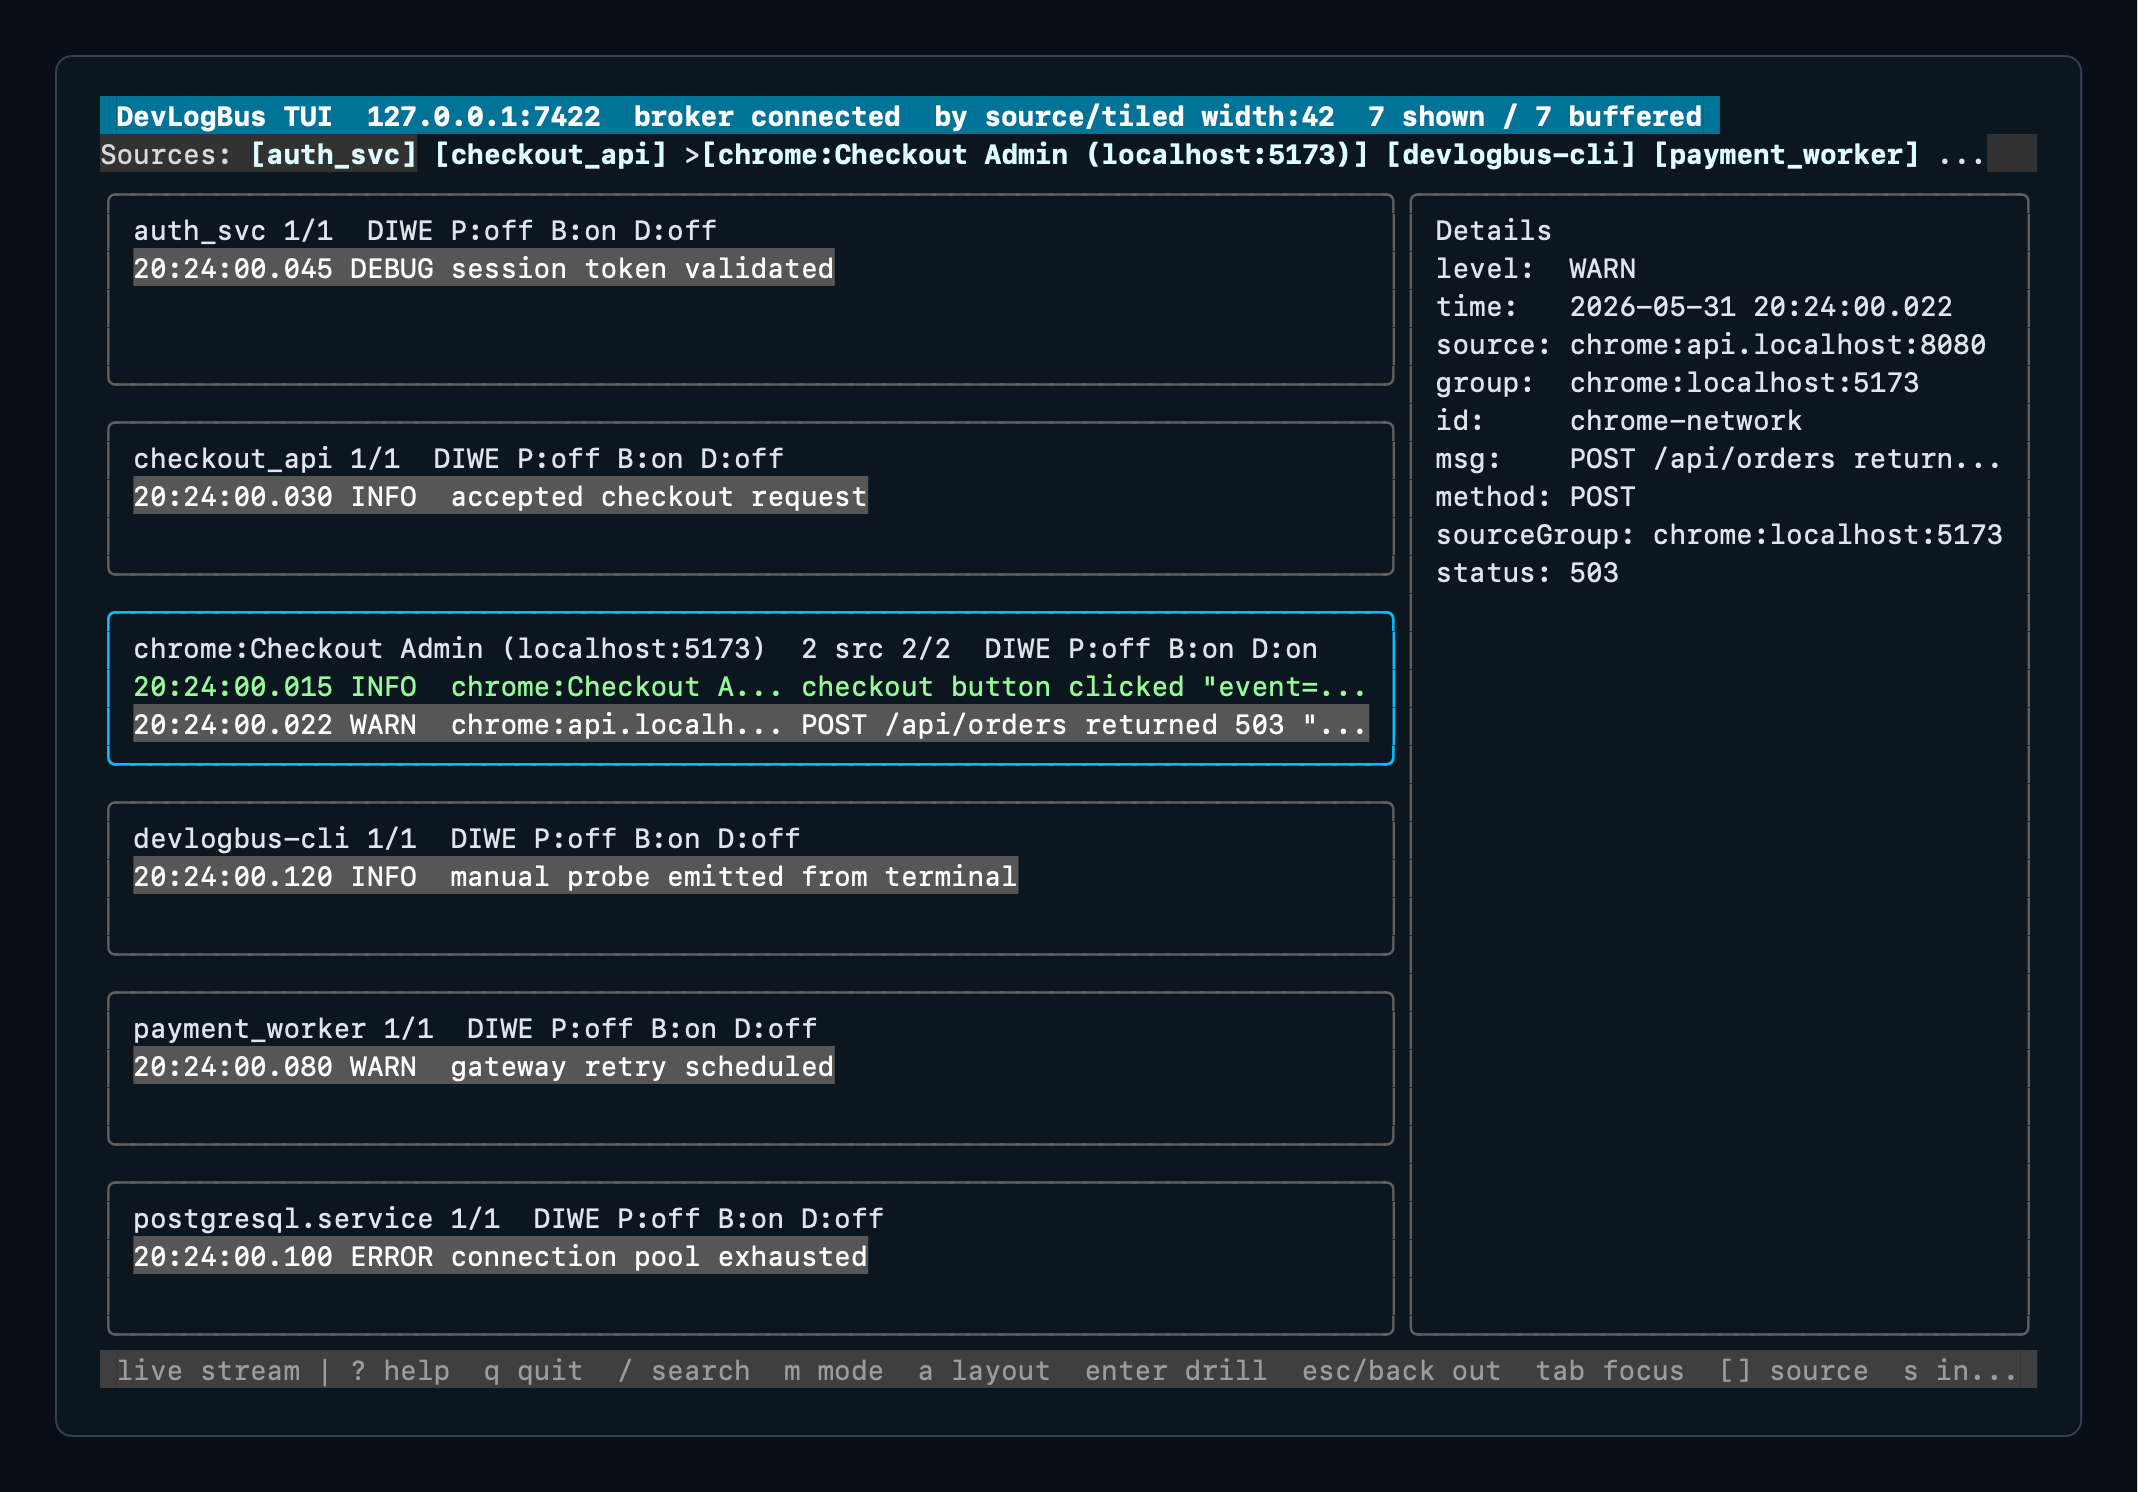
- TUI: terminal viewer modes, source grouping, filters, replay, and keyboard controls.
- CLI:
emit,tail,tui,endpoint,expunge,version,buildinfo, settings, and shell completions. - Browser Tap: Chrome extension install, debugger permission, capture surface, redaction, source grouping, and local publish path.
- Journal Bridge: Linux journald capture, match filters, source mapping, replay, and endpoint handling.
- Go SDK:
protocol,client,sloghandler, and runtime control packages. - SDK Install: install commands for Go, C, .NET/C#, Rust, Java/Kotlin, Node/TypeScript, and Python.
- C SDK: small HTTP publisher with
libcurl, CMake, filter, and redactor callbacks. - .NET / C# SDK:
HttpClientpublisher with structured attrs, filters, redaction, and logger helper. - Rust SDK: dependency-free HTTP publisher with filter and redactor hooks.
- Java/Kotlin SDK: JVM HTTP publisher with filter, redaction, and logger helper.
- Node And TypeScript SDK: HTTP client, logger helper, filters, and redaction.
- Python SDK: HTTP client,
logginghandler, filters, and redaction. - HTTP API and Wire Protocol: record schema, HTTP endpoints, SSE, expunge, replay, and socket envelopes.
- Examples: Go, C, .NET/C#, Rust, Java/Kotlin, Node/TypeScript, Python, and browser workflow examples.
- SDK Publishing: npm, PyPI, crates.io, NuGet, and Maven Central publishing notes.
- Configuration: public endpoint and source conventions.
- Security and Privacy: local-first behavior, Browser Tap data handling, safe usage, and exposure risks.
- Compatibility: v1 compatibility expectations for records, HTTP API, SDKs, CLI, and extension behavior.
- Share DevLogBus: short blurbs and links for low-theater project discovery.
Release And Publishing Notes
- Linux: Linux install, systemd, and journald bridge notes.
- Windows: Windows install and platform limitations.
- Package Managers: Homebrew, Linux package repositories, Scoop, WinGet, and release packaging notes.
- Browser Tap Chrome Web Store Prep: listing text, privacy statement, permission explanations, screenshots, and reviewer notes.
- Browser Tap Privacy Policy: public privacy policy for the Chrome Web Store listing.
Visual Overview
The embedded browser UI gives the widest view; the TUI keeps the same merged/by-source debugging model available from a terminal.
The usual workflow is:
- Start
devlogbusd. - Open the embedded browser UI or terminal UI.
- Publish backend/service logs through the Go, C, .NET/C#, Rust, Java/Kotlin, Node/TypeScript, or Python SDK, HTTP API, or CLI.
- Attach Browser Tap to the active Chrome tab when browser-side events matter.
- Split noisy streams by source, drill into browser source groups, hide or block noise, and expunge only when replay-buffer records should be deleted.